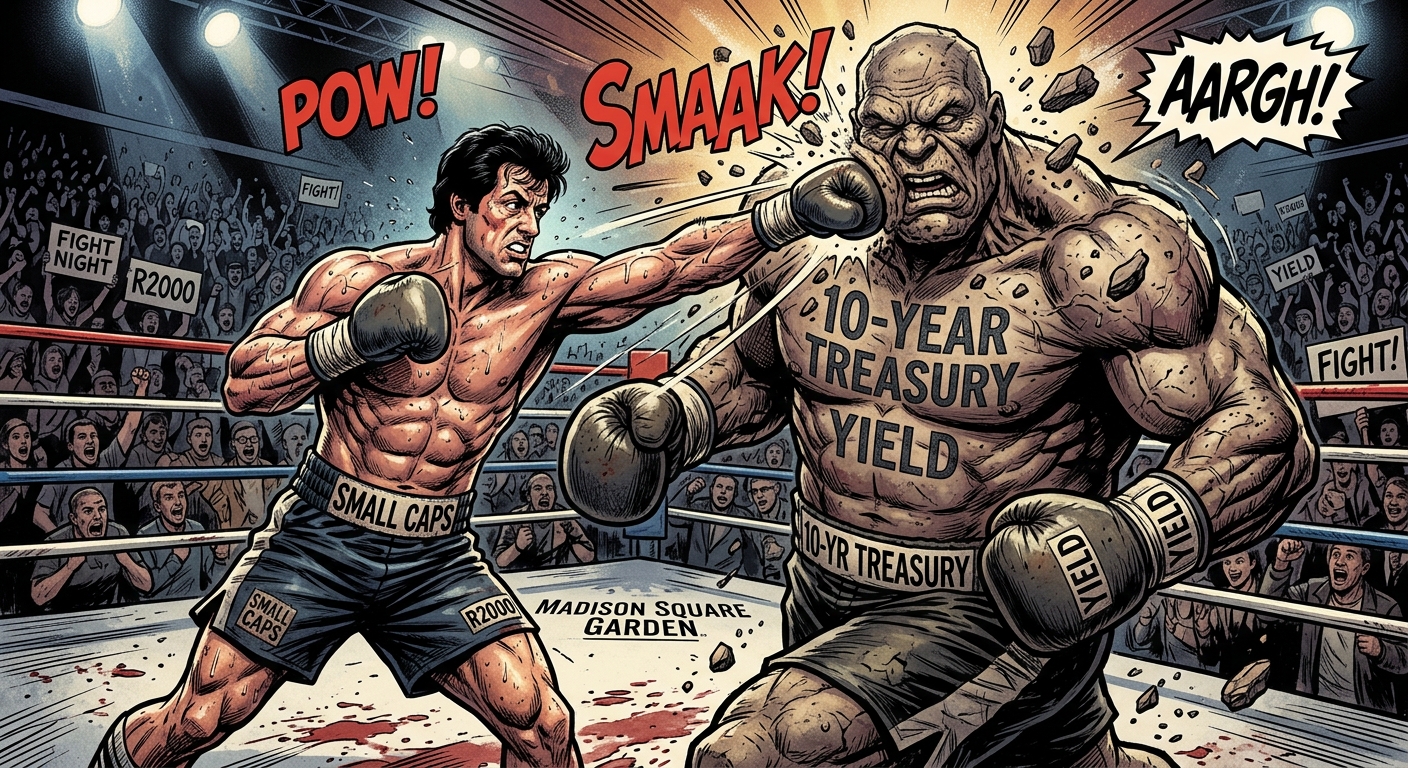
Higher borrowing costs have cooled small-cap stocks. A friendlier bond market could give investors a reason to reconsider IWM.
Wall Street’s smaller companies have spent the past two months discovering that the bond market can be a rather demanding business partner. It contributes no products, attends no sales meetings and still insists on taking a larger share of the economics when yields rise. Yet that pressure is also creating a potentially compelling investment setup. The bullish case for small-cap stocks rests on leverage, both financial and market-related. Businesses that feel rising financing costs most acutely could enjoy meaningful relief if those costs stabilize or decline. If earnings remain resilient, the Russell 2000’s recent retreat could become an opening for investors rather than a verdict on the companies themselves. Smaller businesses’ sensitivity to borrowing conditions is a central feature of the current selloff. The opportunity is conditional, not automatic. But after a sharp divergence between small caps and their larger counterparts, the question is becoming more interesting: How much improvement would it take to change the conversation?
The Russell 2000’s Pullback Has Created a Clear Performance Gap
The Russell 2000 closed October 9, 2026, at 2,806.98, up approximately 0.5% that Friday but down 0.9% for the week. It was the only one of the four major U.S. stock indexes tracked in the Associated Press’s weekly recap to finish lower. Even so, the small-cap benchmark remained up 13.1% for the year. That distinction matters. Small caps were not suffering through an uninterrupted losing year. They were surrendering part of an earlier advance. Against the August 12 record close of 3,045.48 cited by The Lead-Lag Report, the October 9 close represented a decline of approximately 7.8%. The retreat was substantial enough to alter sentiment without erasing the year’s gains. The ETF comparison makes the change in leadership especially clear. According to calculations published by Michael A. Gayed in The Lead-Lag Report, from August 12 through October 9:
- The iShares Russell 2000 ETF (NYSE Arca: IWM) fell 7.9%.
- The Invesco QQQ Trust (NASDAQ: QQQ), which tracks the Nasdaq-100, gained 3.8%.
- The SPDR S&P 500 ETF Trust (NYSE Arca: SPY) rose 0.8%.
That left IWM trailing QQQ by 11.7 percentage points over the period. It also created a useful starting point for a bullish thesis: Small caps no longer need to be the market’s most fashionable address to attract attention. They need a credible reason for investors to revisit the neighborhood.
Why the 10-Year Treasury Yield Matters to Small-Cap Stocks
The timing of the divergence points toward the bond market. The 10-year Treasury yield rose from 4.68% on August 12 to 5.22% on October 8, an increase of 54 basis points, according to the Treasury data cited by The Lead-Lag Report. Over that same period, its analysis found a negative 0.47 correlation between IWM’s daily returns and daily changes in the yield. In that sample, small caps tended to move in the opposite direction from yields. That relationship has an economic foundation. Smaller companies often have more floating-rate debt and fewer financing alternatives than larger businesses. Floating-rate borrowing can become more expensive as the relevant short-term benchmark rises, while debt coming due must be refinanced at prevailing market rates. Higher long-term yields can also weigh on equity valuations by increasing the return investors demand for owning stocks. The distinction between those channels is important. A company’s bank loan does not necessarily reset because the 10-year Treasury moves. Nevertheless, rising Treasury yields can signal a less accommodating financial environment, while higher short-term rates directly affect many floating-rate borrowers. For small-cap investors, the bond market is therefore more than background scenery. It helps determine how much of a company’s operating success ultimately reaches shareholders.
The Bullish Case: Relief Does Not Require a Return to Free Money
The strongest small-cap argument does not depend on interest rates returning to unusually low levels. It depends on conditions becoming less difficult. If long-term yields stabilize, one source of pressure on equity valuations could ease. If financing costs eventually decline, eligible borrowers could see a more direct benefit. Neither development guarantees higher earnings, but both could improve the backdrop for companies whose businesses remain sound. The same financing sensitivity that has hurt smaller companies is what gives a more favorable rate environment potential significance.
The constructive scenario has three ingredients:
- Treasury yields stop establishing higher peaks.
- Small-cap companies demonstrate that revenue, margins and cash generation can withstand the current environment.
- Investors regain confidence that refinancing needs are manageable rather than a threat to shareholder value.
This is a turnaround thesis with an identifiable mechanism, not merely a hope that yesterday’s laggards become tomorrow’s leaders. There is also an important qualification: Falling yields would be most encouraging if they accompanied cooling inflation and durable economic activity. A bond rally driven by a severe growth scare could offer cheaper money while taking away customers. That would be a less elegant bargain.
The IWM-to-SPY Ratio Gives Investors a Useful Scorecard
One of the clearest measures of small-cap leadership is the ratio between IWM and SPY. The Lead-Lag Report calculated that the IWM-to-SPY price ratio stood at 0.358 on October 9, down 12.9% from its June 26 peak of 0.411 and slightly below its year-earlier level. The first-half improvement in small-cap relative performance had effectively been reversed. The ratio is useful because it answers a different question from the Russell 2000’s headline level. A rising IWM price means small-cap investors are making money. A rising IWM-to-SPY ratio means small caps are outperforming the S&P 500 proxy. For a durable comeback, bulls would ideally want both. Relative weakness alone does not establish that small caps are cheap. A price ratio is not a valuation measure, and underperformance can persist. But a sustained turn higher would provide evidence that investors were doing more than buying an occasional dip. It would suggest that market leadership was beginning to broaden.
A Small-Cap Recovery Need Not Mean a Large-Cap Collapse
The appeal of this setup is not that large companies must stumble. It is that smaller companies could participate more fully. The Russell 2000 provides exposure to roughly 2,000 smaller U.S. companies and is commonly used as a gauge of the domestic business environment. Its constituents generally have a more domestic revenue orientation than the multinational companies prominent in large-cap benchmarks. That gives the small-cap thesis a different economic emphasis. Investors are considering the resilience of U.S. business activity, the availability of credit and the ability of smaller enterprises to translate sales into cash. A healthier environment for those companies could coexist with continued strength elsewhere in the market. Wall Street does not have to cancel the large-cap dinner reservation to pull up another chair.
Quality Is the Difference Between Opportunity and an Expensive Lesson
A bullish view of small caps should not become an indiscriminate endorsement of every company with a modest market capitalization. Higher financing costs do not affect all businesses equally. Companies with dependable cash flow and manageable debt have a different starting position from businesses dependent on repeated capital raises. Recent market commentary has similarly emphasized the value of financial strength in a higher-rate environment. For investors evaluating the potential recovery, the useful questions are concrete:
- Can the business cover interest expense comfortably?
- How much debt must be refinanced soon?
- Is operating cash flow sufficient to support investment?
- Does management have flexibility if borrowing conditions remain restrictive?
- Are earnings expectations supported by actual business performance?
IWM offers broad exposure to the small-cap benchmark, but it is not a substitute for a quality screen. The bullish case becomes more persuasive when improving market conditions meet businesses capable of taking advantage of them.
What Would Confirm a Small-Cap Comeback?
The clearest confirmation would come from several developments working together rather than one encouraging trading session:
- A sustained stabilization or decline in Treasury yields.
- An improving IWM-to-SPY ratio.
- Broader participation across smaller stocks.
- Earnings reports that support the case for resilient operations and manageable financing costs.
These are tests of the thesis, not predictions. The reported negative 0.47 correlation also deserves perspective. It describes a historical sample, not a permanent law or a trading formula. Gayed’s analysis explicitly cautions that its correlation and regression results should not be treated as forecasts. Nor should the October 9 snapshot be mistaken for current pricing. Subsequent reporting described additional small-cap weakness, reinforcing that this remains an emerging opportunity rather than a confirmed reversal. Still, the investment logic is becoming easier to define. Small caps have already experienced a meaningful repricing as money became more expensive. If financing conditions improve while business fundamentals hold together, investors could find themselves reconsidering an asset class they recently pushed aside. The bond market does not need to become generous. For small-cap bulls, becoming slightly less demanding could be a productive start.
The Sources
[1] Small Caps Are Paying The 10-Year’s Bill https://www.leadlagreport.com/small-caps-are-paying-the-10-years-bill/
[2] Rising yields are quietly crashing the stock market’s earlier https://www.marketwatch.com/story/rising-yields-are-quietly-crashing-the-stock-markets-earlier-winners-of-2026-a29f2863
[3] How major US stock indexes fared Friday 10/9/2026 https://apnews.com/article/wall-street-stocks-dow-nasdaq-dafbd0c4037ee10e2a9e305f3cfa8e70
[4] What is the Russell 2000 index, and how does it compare https://www.kq2.com/stacker-personal-finance-investing/2026/10/16/what-is-the-russell-2000-index-and-how-does-it-compare-to-the-sp-500-and-nasdaq-100/
[5] S&P 500 Bull Market Has Reasons For Optimism, Says Baird https://finance.yahoo.com/markets/stocks/articles/p-500-bull-market-reasons-122818371.html
[6] Week in Review: Oil Up, Interest Rates and Tech Lower as Volatility Rises https://schwabnetwork.com/articles/week-in-review-oil-up-interest-rates-and-tech-lower-as-volatility-rises
[7] Treasury yields put homebuilders, utilities at risk https://www.cnbc.com/2026/10/16/treasury-yields-rate-sensitive-stocks.html
[8] Felix Nikolas Prehn on mortgage rates and the 10-year Treasury yield https://investinglive.com/education/felix-nikolas-prehn-on-mortgage-rates-and-the-10-year-treasury-yield/
[9] How major US stock indexes fared Friday 10/9/2026 https://finance.yahoo.com/markets/world-indices/articles/major-us-stock-indexes-fared-201628920.html
[10] Three Different Yields, One Misleading Comparison https://infrastructurecapital.substack.com/p/three-different-yields-one-misleading
[11] Russell 2000 Index Overview (RUT) | Barron’s https://www.barrons.com/quote/index/RUT
[12] How major US stock indexes fared Friday 10/9/2026 https://www.washingtonpost.com/business/2026/10/09/wall-street-stocks-dow-nasdaq/63e004dc-c41e-11f1-8170-681419af1cc9_story.html
[13] Russell 2000 Index Price & News – WSJ | RUT https://www.wsj.com/market-data/quotes/index/RUT/historical-prices
[14] Download RUT Data | Russell 2000 Index Price Data | MarketWatch https://www.marketwatch.com/investing/index/rut/download-data
[15] 10-Year Treasury Yield Pulls Back to 5.22% After a Relentless … https://247wallst.com/cards/the-first-real-breather-in-a-yield-climb-that-has-run-above-macro-release-01m4heem7sz9bbv1dz0rvt8a09
[16] Russell 2000 Today: Oil Jumps, Yields Near 24-Year High https://admiralmarkets.com/analytics/traders-blog/russell-2000-oil-prices-treasury-yields
[17] 5% Nominal, Nearly 3% Real: The True Cost Of Money Is Rising https://seekingalpha.com/article/4954030-5-percent-nominal-nearly-3-percent-real-true-cost-of-money-rising
[18] Russell 2000 heads into Monday as oil eases 0.5 percent https://www.ad-hoc-news.de/boerse/news/marktberichte/russell-2000-heads-into-monday-as-oil-eases-0-5-percent/70301078
[19] 5% Nominal, Nearly 3% Real: The True Cost of Money Is https://www.investing.com/analysis/5-nominal-nearly-3-real-the-true-cost-of-money-is-rising-200689543
[20] S&P 500 up 0.59% Market Pulse · Oct 9, 2026 https://deanfi.com/insights/marketpulse/2026-10-09/
[21] The middle got cheaper the edge did not – Options Brief https://www.home.saxo/en-sg/content/articles/options/the-middle-got-cheaper-the-edge-did-not-options-brief-12-october-2026-12102026
[22] From a record high to a 10% drop in just two months https://www.morningstar.com/news/marketwatch/20261014452/from-a-record-high-to-a-10-drop-in-just-two-months-why-small-cap-stocks-have-unraveled-so-fast
[23] Small Caps Had Their Best Run In Decades. Rising Rates Are Their Biggest Test Yet https://www.forbes.com/sites/jasonkirsch/2026/10/14/small-caps-had-their-best-run-in-decades-rising-rates-are-their-biggest-test-yet/
[24] Soaring Treasury Yields Hammer Small Caps as Russell 2000 Nears Correction, Capital Floods into Magnificent Seven https://finance.biggo.com/news/79a8a13f-8b17-4eaf-822c-106cbbb2ae50
Stay Updated with Vista Partners
Subscribe to receive market insights, investing ideas, and the latest updates directly in your inbox.