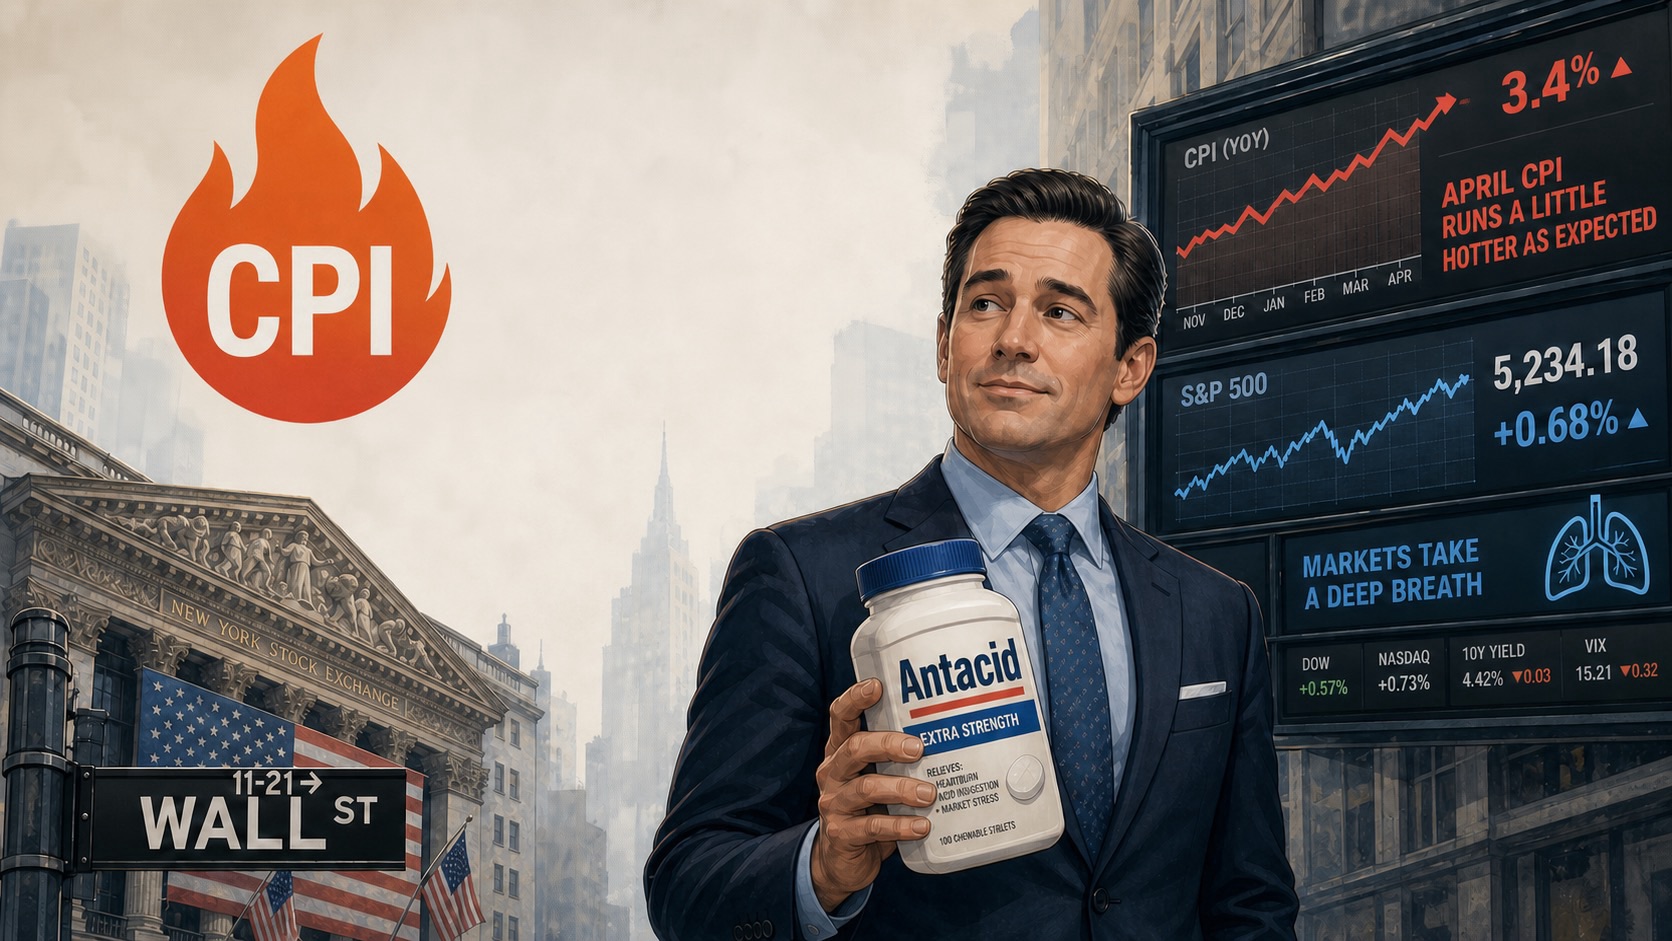
April’s consumer price index didn’t exactly crash the party, but it did show up with an extra guest: a touch more inflation than markets ordered. Year‑over‑year CPI rose about 3.8% in April, marginally topping economists’ expectations of roughly 3.7% and marking a jump from March’s 3.3% pace.
That puts inflation at its highest level in almost three years, powered less by consumers’ enthusiasm and more by the rising cost of energy and a few stubborn essentials that refuse to go on sale. Investors who started the year dreaming about multiple rate cuts are now revising those fantasies down to something closer to “maybe later.”
Gasoline Takes the Lead Role
If April’s inflation report were a movie, gasoline would be the star, the producer, and possibly the craft‑services budget. A sharp run‑up in gas prices— (we just paid $7/gallon last night in San Francisco) fueled by ongoing conflict with Iran and higher oil benchmarks—has filtered quickly into the CPI data. Since late February, pump prices have climbed dramatically, with gas up nearly 50% from the onset of the conflict and more than 28% year‑over‑year.
The mechanics are straightforward even if the receipts are painful: higher crude prices flow into gasoline, which in turn raises transportation and logistics costs, which then quietly inflate the price tags on everything from groceries to furniture. For most households, the most visible reminders live on the gas station marquee and in the meat aisle, where beef prices have jumped nearly 15% from a year earlier.
The Fed’s Patience Gets Another Test
For the Federal Reserve, April’s data falls into the category of “inconvenient but not catastrophic.” Inflation is clearly above the central bank’s 2% target, and the reacceleration from March’s 3.3% pace to 3.8% will not encourage officials to reach for the rate‑cut lever anytime soon.
Coming into the year, markets were pricing in an aggressive path of easing; by now, those expectations have been trimmed as persistently firm inflation and higher energy prices complicate the outlook. Policymakers can still argue that some of the pressure reflects temporary pass‑through from oil and geopolitical shocks, but each hotter‑than‑hoped monthly reading nudges them toward a longer “wait and see” stance.
Households Feel It at the Everyday Level
The CPI may be an index, but it lands in very human places: the grocery cart, the commute, the utility bill. Food prices are running a bit over 3% higher than a year earlier, adding a steady headwind to household budgets even as some goods categories have cooled from the post‑pandemic surge.
Housing and energy continue to do their part as well, with shelter costs and fuel contributing a meaningful share of the monthly gain. For many families, the mental CPI boils down to two lines: the cost of filling the tank and the price of a pound of beef—both of which have been moving in the wrong direction. The State Street Energy Select Sector SPDR ETF, an ETF that focuses on large-cap energy stocks like ExxonMobil (XOM, $127.36, +1.37%), Chevron, and ConocoPhillips, is up 28.27% YTD.
Markets Juggle Higher Oil and Higher Hopes
Equity markets took the April data in stride but not in silence. Oil prices and Treasury yields have been drifting higher, reflecting both geopolitical risk and the sense that “higher for longer” may apply to rates as well as energy. Yet risk appetite has hardly evaporated; chip stocks and other growth names have continued to push major indexes toward or into fresh records, suggesting investors still see enough earnings power to look through inflation bumps—for now.
The picture is nuanced: hotter CPI and pricier oil lean against early rate‑cut hopes, but strong corporate profits and resilient demand keep the floor from falling out under equities. In classic Wall Street fashion, the market seems willing to live with 3‑something inflation so long as earnings stay 10‑something and GDP avoids anything starting with a zero.
What It Means for the Months Ahead
April’s CPI report doesn’t rewrite the economic narrative, but it does edit a few key lines. With inflation ‘re‑accelerating’ and energy acting as an unwelcome supporting actor, the bar for near‑term Fed easing has moved higher, and rate‑sensitive sectors will trade accordingly.
For households, the near‑term prescription is familiar: watch gas and grocery bills, brace for elevated summer travel costs, and hope the current oil‑driven pressures prove more spike than trend. For investors, the story is a bit more nuanced—a world where inflation isn’t spiraling, but isn’t quite ready to fade into the background either.
The Sources
- CNBC – “Here’s the inflation breakdown for April 2026 — in one chart”
https://www.cnbc.com/2026/05/12/inflation-breakdown-for-april-2026-cpi-chart.htmlcnbc - Yahoo Finance – “April inflation comes in hotter than expected: CPI data breakdown”
https://finance.yahoo.com/video/april-inflation-comes-in-hotter-than-expected-cpi-data-breakdown-124005012.htmlfinance.yahoo - Forex Factory – “April US inflation comes in hotter than expected: CPI data breakdown”
https://www.forexfactory.com/news/1397977-april-us-inflation-comes-in-hotter-than-expectedforexfactory - CNBC – “Consumer prices rose 3.8% annually in April, the highest since May 2023”
https://www.cnbc.com/2026/05/12/cpi-inflation-april-2026-.htmlcnbc - LiveNow FOX – “CPI report: April inflation jumped at fastest rate in three years”
https://www.livenowfox.com/news/cpi-report-april-inflation-jumped-fastest-rate-three-yearslivenowfox - Quartz – “U.S. CPI rose 3.8% in April 2026, highest since May 2023”
https://qz.com/us-cpi-inflation-april-2026-energy-gas-prices-051226qz - Stocktwits News – “US CPI Report April 2026: Consumer Prices Rise Fueled By Energy Prices, Highest Since 2023”
https://stocktwits.com/news-articles/markets/equity/us-consumer-inflation-april-2026-cpi-report/cZXXfE8Rei2stocktwits - U.S. Bureau of Labor Statistics – “Consumer Price Index, 12‑month percentage change by category”
https://www.bls.gov/charts/consumer-price-index/consumer-price-index-by-category-line-chart.htmbls - U.S. Bureau of Labor Statistics – “Consumer Price Index Databases”
https://www.bls.gov/cpi/data.htmbls - U.S. Bureau of Labor Statistics – “Consumer Price Index Summary – March 2026” (baseline reference for prior month)
https://www.bls.gov/news.release/cpi.nr0.htmbls
Stay Updated with Vista Partners
Subscribe to receive market insights, investing ideas, and the latest updates directly in your inbox.